Lab 6B: Backtest Overfitting (CSCV, PBO, PSR/DSR)
Before You Code: The Big Picture
The #1 problem in quantitative finance: your backtest looks great, but it fails in live trading. Why? Overfitting: you optimized parameters on the same data you tested on. Your “alpha” is actually selection bias.
NoteThe Backtest Overfitting Problem
The Scenario: You test 200 trading strategies on 20 years of data. One strategy has a Sharpe ratio of 2.5: amazing! You deploy it with real money. It loses money immediately. What happened?
The Problem: - With 200 tries, one will look good by pure luck (multiple testing) - In-sample optimization + in-sample testing = guaranteed overfitting - Traditional cross-validation doesn’t detect this (data leakage across folds)
The Solution (Bailey & López de Prado): 1. CSCV (Combinatorially Symmetric Cross-Validation): Proper walk-forward splits 2. PBO (Probability of Backtest Overfitting): Quantifies selection bias 3. PSR (Probabilistic Sharpe Ratio): Tests if Sharpe > 0 with statistical significance 4. DSR (Deflated Sharpe Ratio): Adjusts for multiple testing
The Evidence: Harvey, Liu & Zhu (2016, RFS): Most published factor strategies fail out-of-sample due to p-hacking and multiple testing. PBO/PSR help detect this before losing real money.
What You’ll Build Today
By the end of this lab, you will have:
- ✅ Understanding of why standard backtesting fails
- ✅ CSCV implementation for honest validation
- ✅ PBO calculation showing selection bias
- ✅ PSR/DSR metrics for performance significance
- ✅ Critical perspective on published trading strategies
Time estimate: 90-120 minutes (this is advanced material: take your time)
ImportantWhy This Matters for Coursework 2
Your factor replication must use walk-forward validation and report PBO/PSR. Otherwise, your Sharpe ratio is meaningless: it’s just in-sample optimization parading as out-of-sample performance. This lab shows you how to do it right.
Objectives
- Diagnose backtest overfitting with combinatorially symmetric cross‑validation (CSCV)
- Estimate Probability of Backtest Overfitting (PBO)
- Quantify performance significance via Probabilistic Sharpe Ratio (PSR); discuss Deflated Sharpe Ratio (DSR)
Note
This lab follows Bailey & López de Prado’s approach to selection bias: CSCV → PBO and PSR/DSR. We implement lightweight utilities and show how to compare against mlfinlab if available.
Setup
Part A : A garden of strategies on pure noise
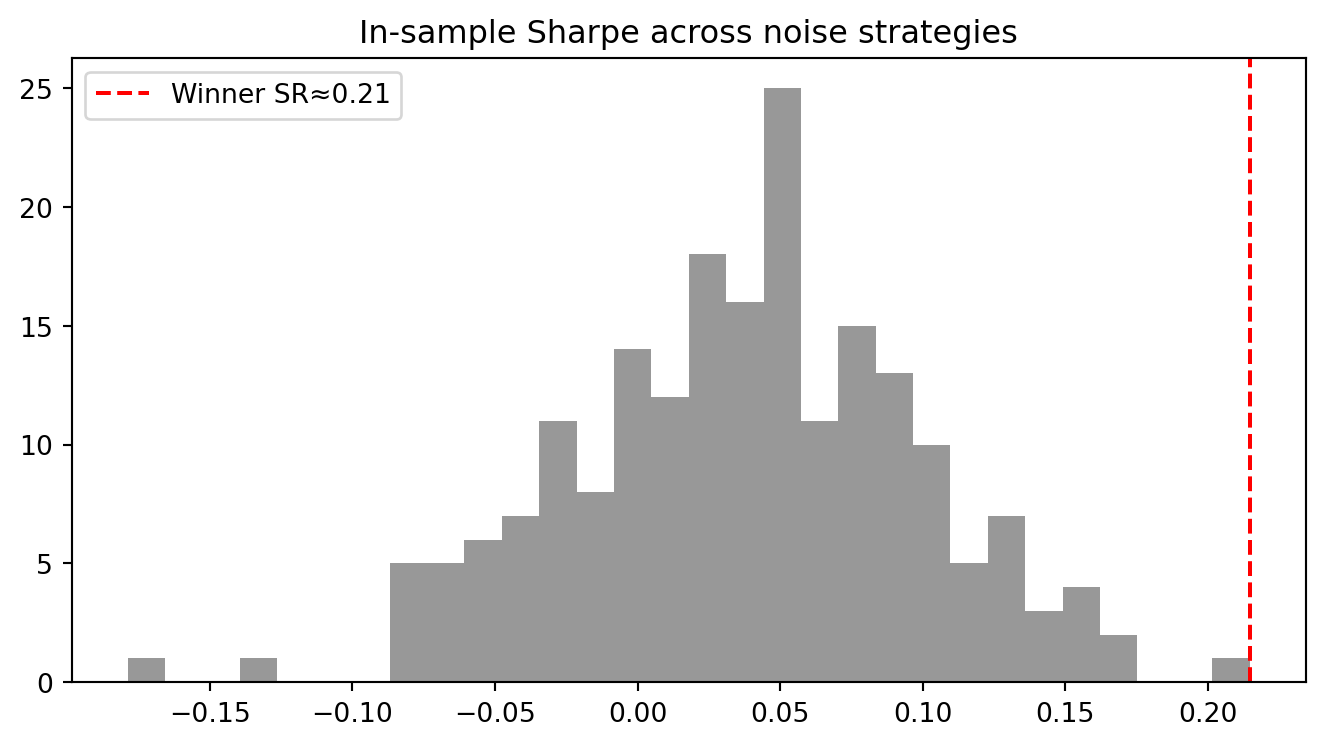
We simulate N=200 strategies with no true edge. In a finite sample, one will “win” in‑sample by chance.
Observation: Even with zero true edge, the best in‑sample Sharpe can look compelling.
Part B : CSCV and Probability of Backtest Overfitting (PBO)
We split the time axis into contiguous folds and repeatedly pick the in‑sample “champion”, then measure its out‑of‑sample rank. PBO is the fraction of splits where the champion underperforms out‑of‑sample (negative logit rank).
(0.6, 150)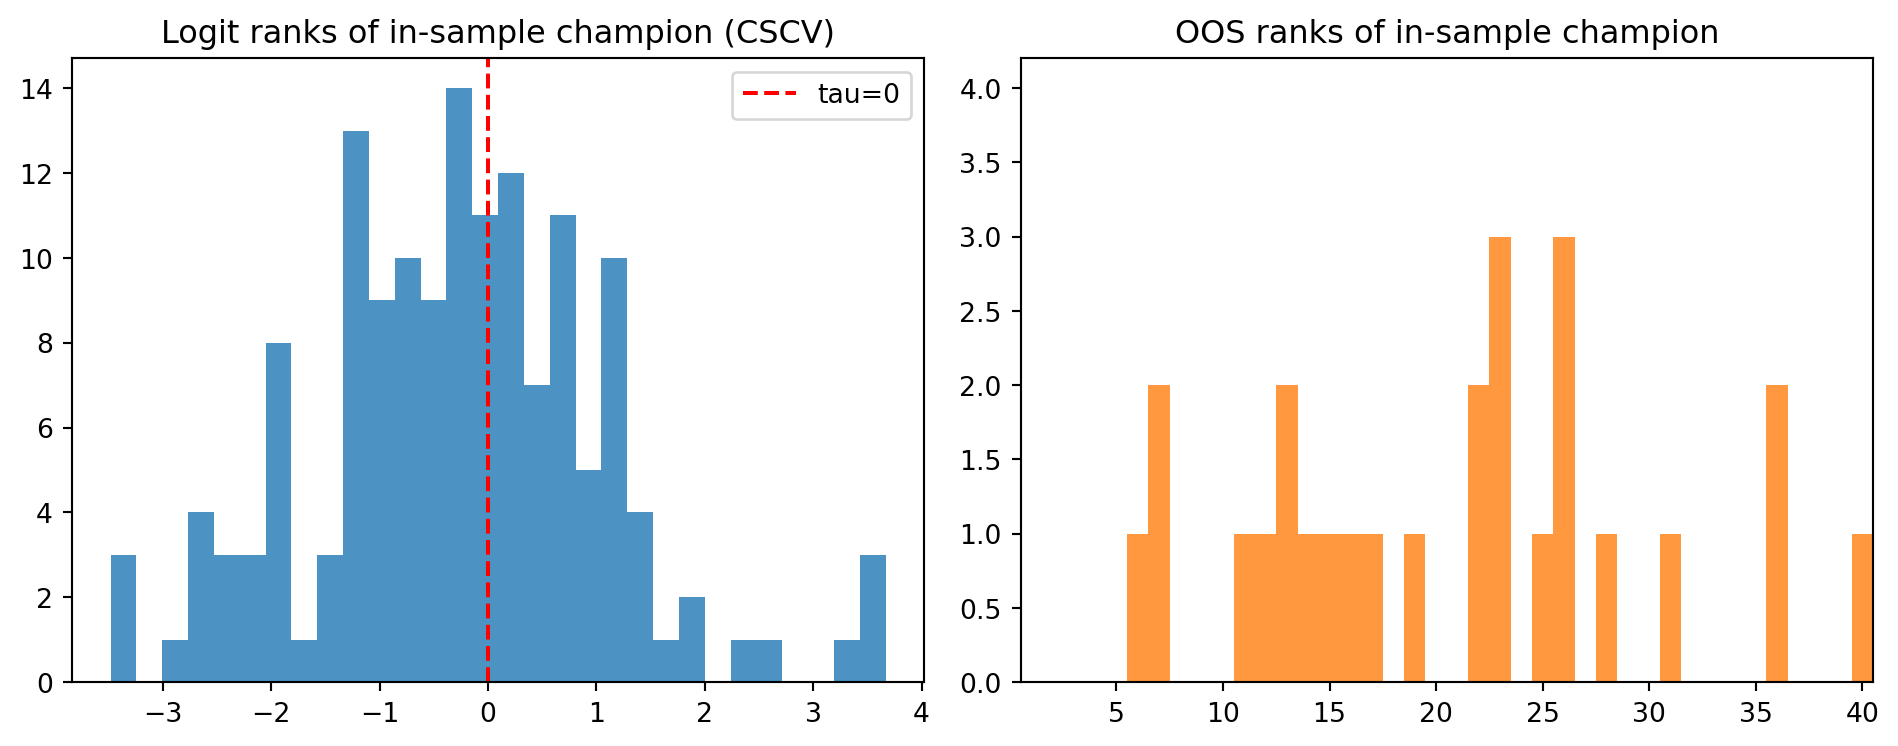
Interpretation: A high PBO indicates that selecting the in‑sample “winner” is likely to disappoint out‑of‑sample.
Part C : PSR and discussion of DSR
We compute the Probabilistic Sharpe Ratio (PSR) of the champion against a 0 benchmark. DSR additionally deflates for selection bias by using a higher benchmark Sharpe (selection threshold). If mlfinlab is installed, we compare against its DSR.
0.9994357939306875Optional: compare with mlfinlab’s DSR (if available). Note DSR uses an elevated benchmark Sharpe that accounts for the number of trials and their correlation (see paper for details).
Optional : Empirical Selection Benchmark (SR*)
An intuitive (but approximate) benchmark SR* is the selection threshold you would have used to promote a strategy, e.g., the 95th percentile of candidate SRs or the top‑k cutoff used in model selection. This inflates the benchmark to reflect the search.
(np.float64(0.13389655969594796), 0.8896047744919638)
Tip
Guidance: PSR answers “what is the probability that the true SR > benchmark SR?”. DSR raises SR to deflate for selection bias (many trials and correlation among them). When reporting results, disclose the number of trials and use CSCV/PBO to evidence robustness.
Extension : Replace noise with weak‑edge signals
Modify the simulation so a small subset of strategies has a slight positive mean. Re‑run CSCV/PBO and PSR to see whether evidence accumulates honestly.
0.6071428571428571Deliverables
- Report the observed PBO and interpret its meaning
- Report PSR for the selected strategy; if available, compare with DSR
- Describe how your result changes when a few strategies have a genuine (small) edge
How to Report (Template)
- Trials: We evaluated N strategies/hyper‑parameters (comment on similarity/correlation if relevant).
- Selection: In‑sample selection metric = [Sharpe/alpha/etc.] with CSCV splits (k=10).
- Robustness: PBO = X.XX across S splits (show logit rank histogram).
- Significance: PSR = X.XX vs SR*=0 (skew=…, kurt=…, n=…)
- Optional: DSR = X.XX (assumptions: trials=N, rho=…, length=n).
- Optional: DSR = X.XX (assumptions: trials=N, rho=…, length=n).
- Data: period, universe, costs/slippage, vintages/release timing.
- Decision: [Promote/Park], rationale and next steps (e.g., live paper trading).
References
References
Bailey, David H., Jonathan M. Borwein, Marcos López de Prado, and Qiji Jim Zhu. 2015. “The Probability of Backtest Overfitting.” Journal of Computational Finance. https://doi.org/10.2139/ssrn.2326253.
Bailey, David H., and Marcos López de Prado. 2014. “The Deflated Sharpe Ratio: Correcting for Selection Bias, Backtest Overfitting and Non-Normality.” Journal of Portfolio Management 40 (5): 94–107. https://doi.org/10.2139/ssrn.2460551.