Statistical Science for Finance
Rigorous Methods for Technology-Enabled Markets
Welcome
We take data science to mean the disciplined study of variation and uncertainty in data. Variation is what we model: differences across units, over time, between groups. Uncertainty is what we quantify: the limits of what we can know from finite samples and noisy measurements. Everything in this course builds from that foundation.
Acting in the Dark

“We are forced to act largely in the dark.” : Fischer Black, Presidential Address (1986)
Financial data is fundamentally noisy. Black (1986) observed that “noise makes it very difficult to test either practical or academic theories about the way that financial markets work” and “keeps us from knowing the expected return on a stock or portfolio.” People trade on noise as if it were information; our observations are imperfect; certainty is illusory.
What does this mean quantitatively? A rigorous way to measure signal is to ask: how much of return variance is predictable? We fit Bayesian AR(1) models to daily returns from our Bloomberg database, where the R² = ρ² (squared autocorrelation) gives the fraction of variance predictable from lagged returns. The Bayesian approach yields not just point estimates but posterior distributions that quantify our uncertainty about predictability.
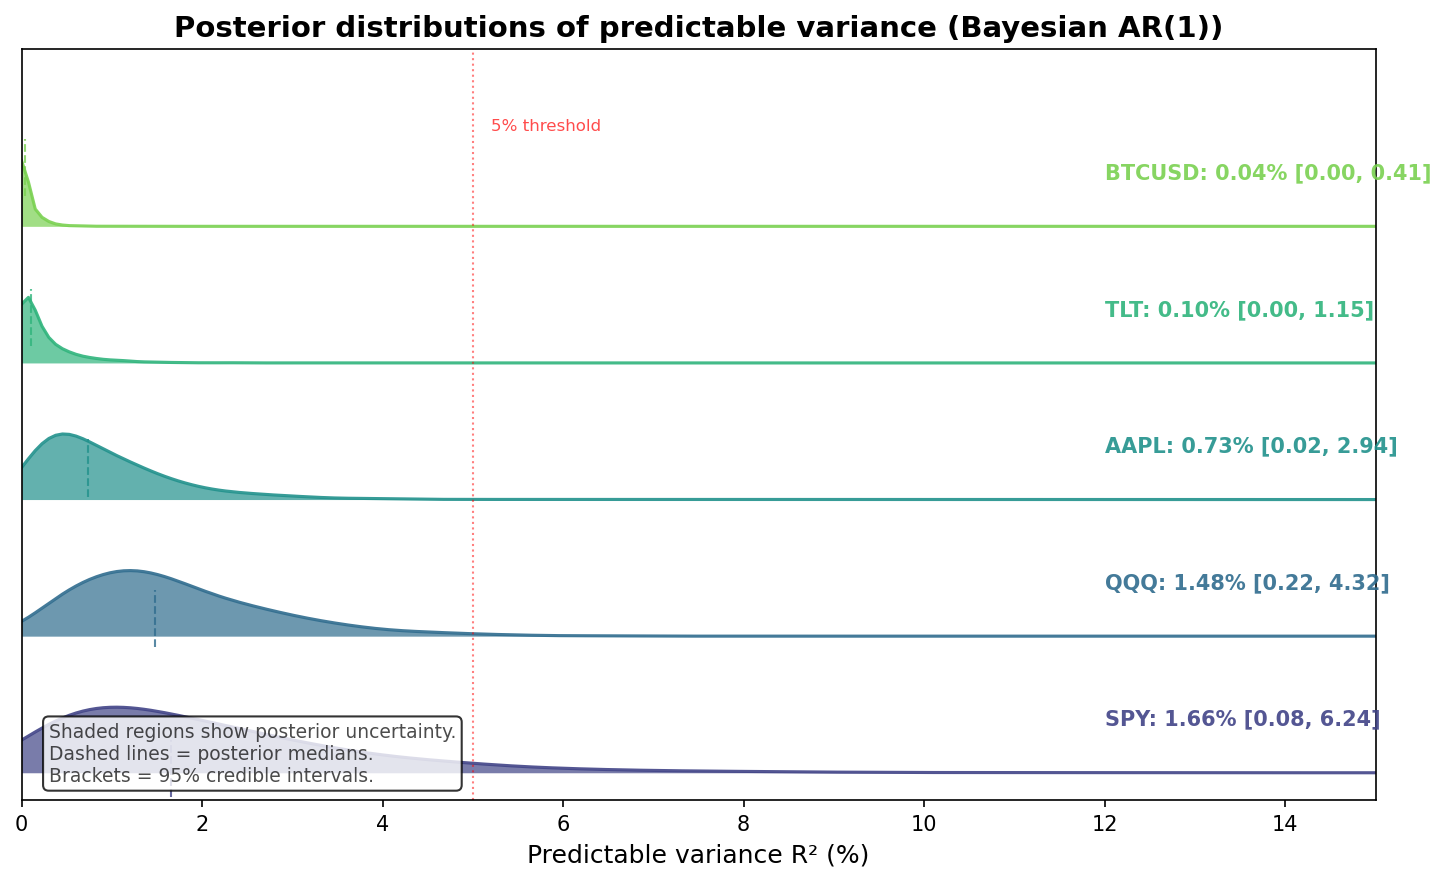
Even accounting for uncertainty, the predictable fraction is consistently under 5%: typically 0.5–2%. This is consistent with academic findings on return predictability (Goyal and Welch 2008; Campbell and Thompson 2008). Notice that the credible intervals are wide (e.g., SPY: 0.08–6.2%): but this width is itself informative. It reveals that we cannot even precisely measure how little predictability there is because the signal is so weak relative to noise. Even at the optimistic upper bounds, over 93% of variance remains unpredictable. The wide intervals do not undermine the conclusion; they reinforce it. This is the fundamental nature of financial markets, not a data quality problem to be solved with better APIs.
The Three Prediction Problems
This near-zero predictability in returns is not a failure of our models: it is a success of markets. Competition arbitrages away predictable patterns in expected returns, leaving the conditional mean unforecastable. But this applies specifically to the mean. Financial prediction actually divides into three distinct problems with different signal strengths:
| Problem | Target | Signal | Course Focus |
|---|---|---|---|
| The Mean | Future returns | ~1-2% R² | Accept randomness; naive often wins |
| The Variance | Volatility | ~15-40% R² | GARCH models (Week 4); economically valuable |
| The Cross-Section | Which assets | ~5-15% R² | Factor models, ML (Weeks 10-11); alpha generation |
This hierarchy shapes everything we teach. Traditional textbooks present ARIMA as a prediction tool for returns, implying more sophisticated models yield better predictions. But ARIMA targets the conditional mean: precisely where competition has eliminated signal. The economically valuable prediction happens elsewhere: in variance (volatility clustering is real and exploitable) and cross-section (which stocks outperform is partially predictable). We structure the course around this insight: acknowledge the limits of return prediction, master volatility modelling where signal exists, and learn factor/ML methods for cross-sectional alpha where the opportunity lies.
The Challenge of Inference
Yet we must make inferences, build models, and guide decisions despite this irreducible uncertainty. Gelman, Hill, and Vehtari (2020) frames our challenge through three types of generalisation: from sample to population, from observed to counterfactual, from measurement to construct. Each appears constantly in finance.
When we observe 100 stocks and attempt to say something about “the market,” we generalise from sample to population. When performance improves after adopting a strategy, we wonder whether the strategy caused improvement: generalising from observed to counterfactual. When we quantify risk using historical volatility, we generalise from imperfect measurement to underlying construct.
Kelly, Malamud, and Zhou (2024) recently demonstrated that while “complex models can severely outperform simple models in return prediction,” the practical gains from complexity are often modest. Feasible three-variable solutions achieve 100% out-of-sample effectiveness compared to theoretically optimal high-dimensional models. This validates Black’s 1986 insight: noise limits the benefits of sophistication.
Course Philosophy
This course develops the capabilities needed for responsible data science in technology-enabled financial services: statistical foundations that distinguish signal from noise through proper validation and uncertainty quantification, professional competence with Bloomberg Terminal data and production-ready implementations, and critical thinking that balances sophisticated methods with intellectual humility about their limitations.
Following Box and Draper (1987) wisdom that “all models are wrong, but some are useful,” we emphasize rigorous validation over performance theatre, causal reasoning over correlation mining, and honest evaluation over technological narratives. From Black’s insight about acting “in the dark,” through Gelman’s framework for generalisation under incomplete information, to modern machine learning: sophisticated tools require sophisticated understanding of their limitations.
Note on targets: We model and evaluate returns (simple/log, often excess returns) rather than prices, for stationarity and comparability. See the Primer’s “Financial Returns: Targets and Notation” for definitions and a short example.
Course Approach
Integrated Analytical Framework
- Statistical Foundations: Distinguishing signal from noise through bias-variance tradeoff, regularisation, and validation
- Causal Reasoning: Moving beyond correlation to understand mechanisms and counterfactuals
- Technical Implementation: Python programming for production-ready financial systems with Bloomberg Terminal integration
- Professional Practice: Rigorous workflows for model development, testing, and monitoring
- FinTech Applications: Applying these methods to open banking, digital credit, robo-advisors, cryptocurrency, and algorithmic finance
Contact
Professor Barry Quinn
Professor of Finance and Financial Technology | Director, Centre for Finance and Responsible Technology
📧 b.quinn1@ulster.ac.uk | 🏢 Room BC-08-205B
Office Hours: By appointment
📄 Full CV/Resume
Ulster University Business School | BSc Finance and Investment Management/MSc FinTech Management